Pi-hole v3.2 Introduces Long-term Statistics, An Audit Log, Colours, and More!

We are very pleased to release a new version of Pi-hole–version 3.2. This release comes with a long-awaited request: long-term statistics. You can now store and view more than 24 hours worth of Pi-hole data to help see your historical queries and performance.
We also have a new audit log for keeping track of domains you may want to white or blacklist, a new tabular settings page for easier navigation, and an improved debugger. Not only that; you’ll also notice colorized output on the command line as well as a slew of fixes and improvements. This is a big release so read on to find out more.
What’s New?
Long-term Statistics: one of our most requested features
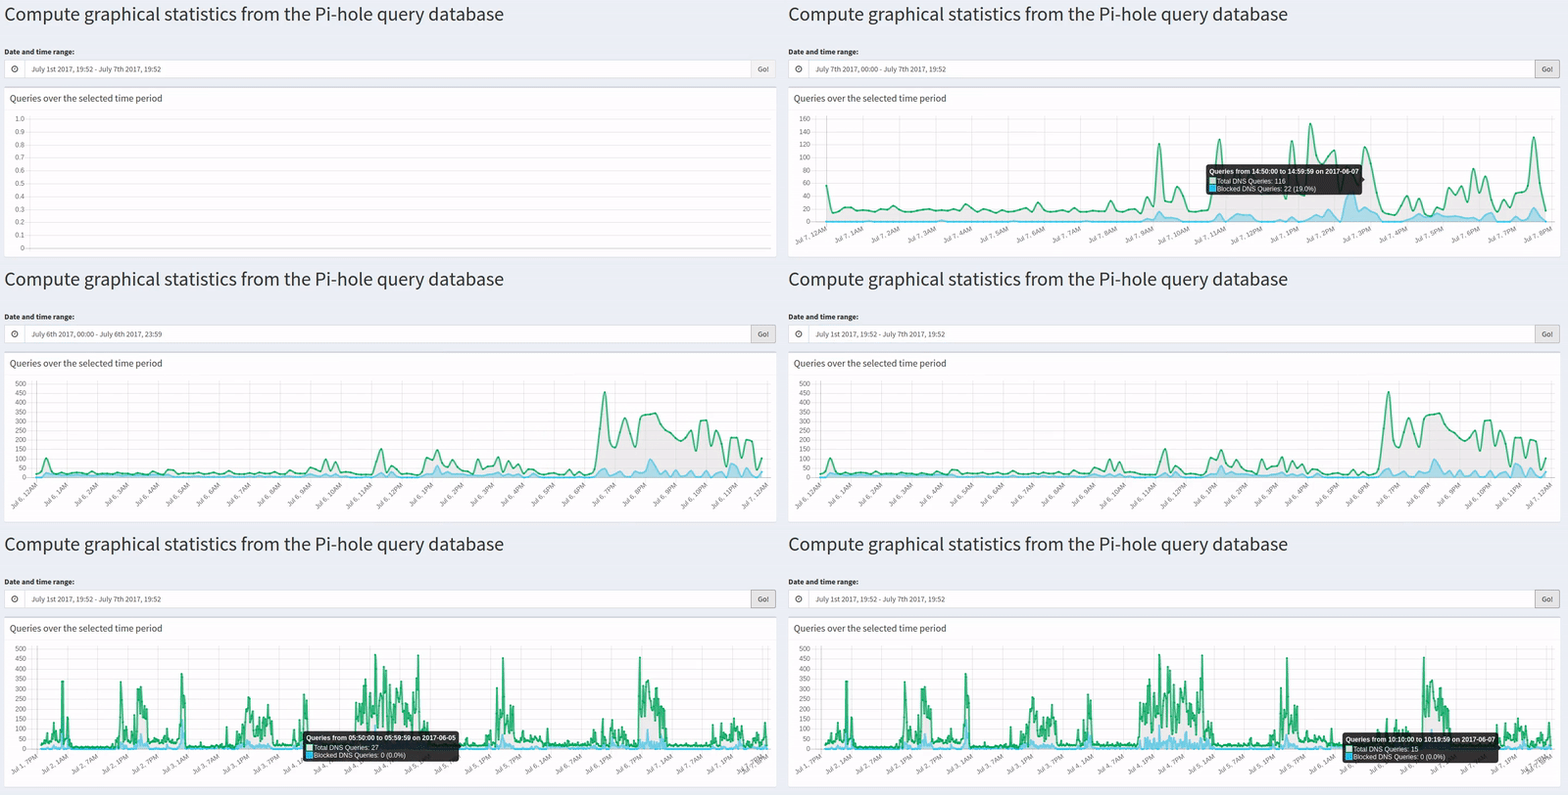
Thanks to FTL, Pi-hole is no longer limited to 24 hours worth of statistics (but we still flush the logs daily). If logging is enabled, your queries will now be stored in a database and can be queried from the dashboard.
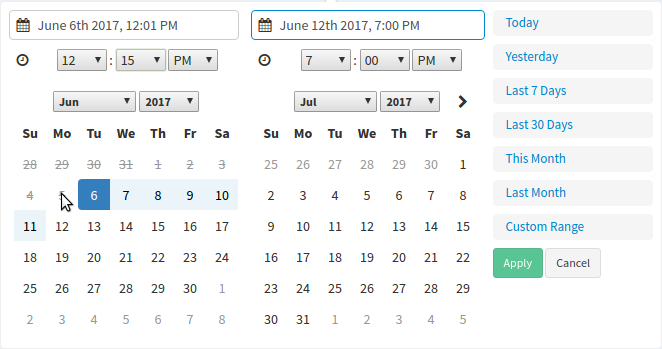
We have seen a rise in companies, organizations, and other small businesses installing and using Pi-hole so we think they will appreciate this feature. Home users will also have fun digging through their historical network activity. Who knows, you may find something interesting happening on your network.
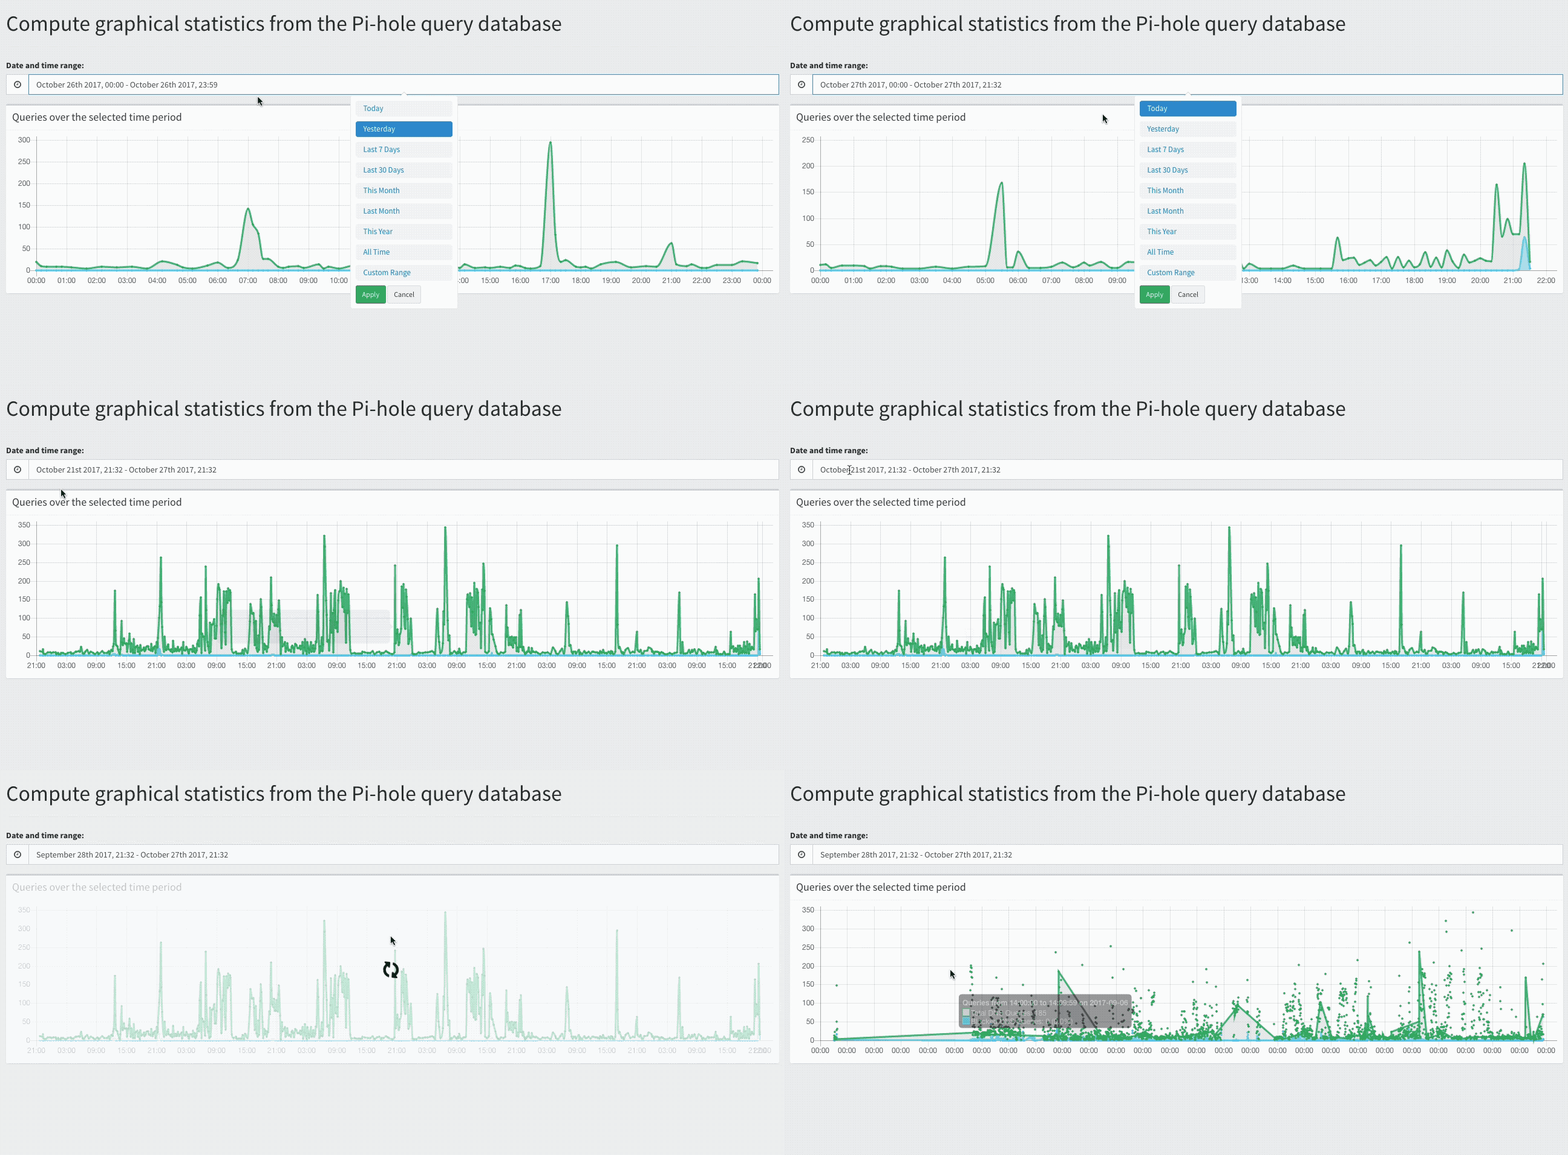
Using this new feature is pretty straightforward: just pick a date range and click Apply. FTL will then parse through the database and generate the statistics.
You can view the long-term stats in a graph,

a query log,
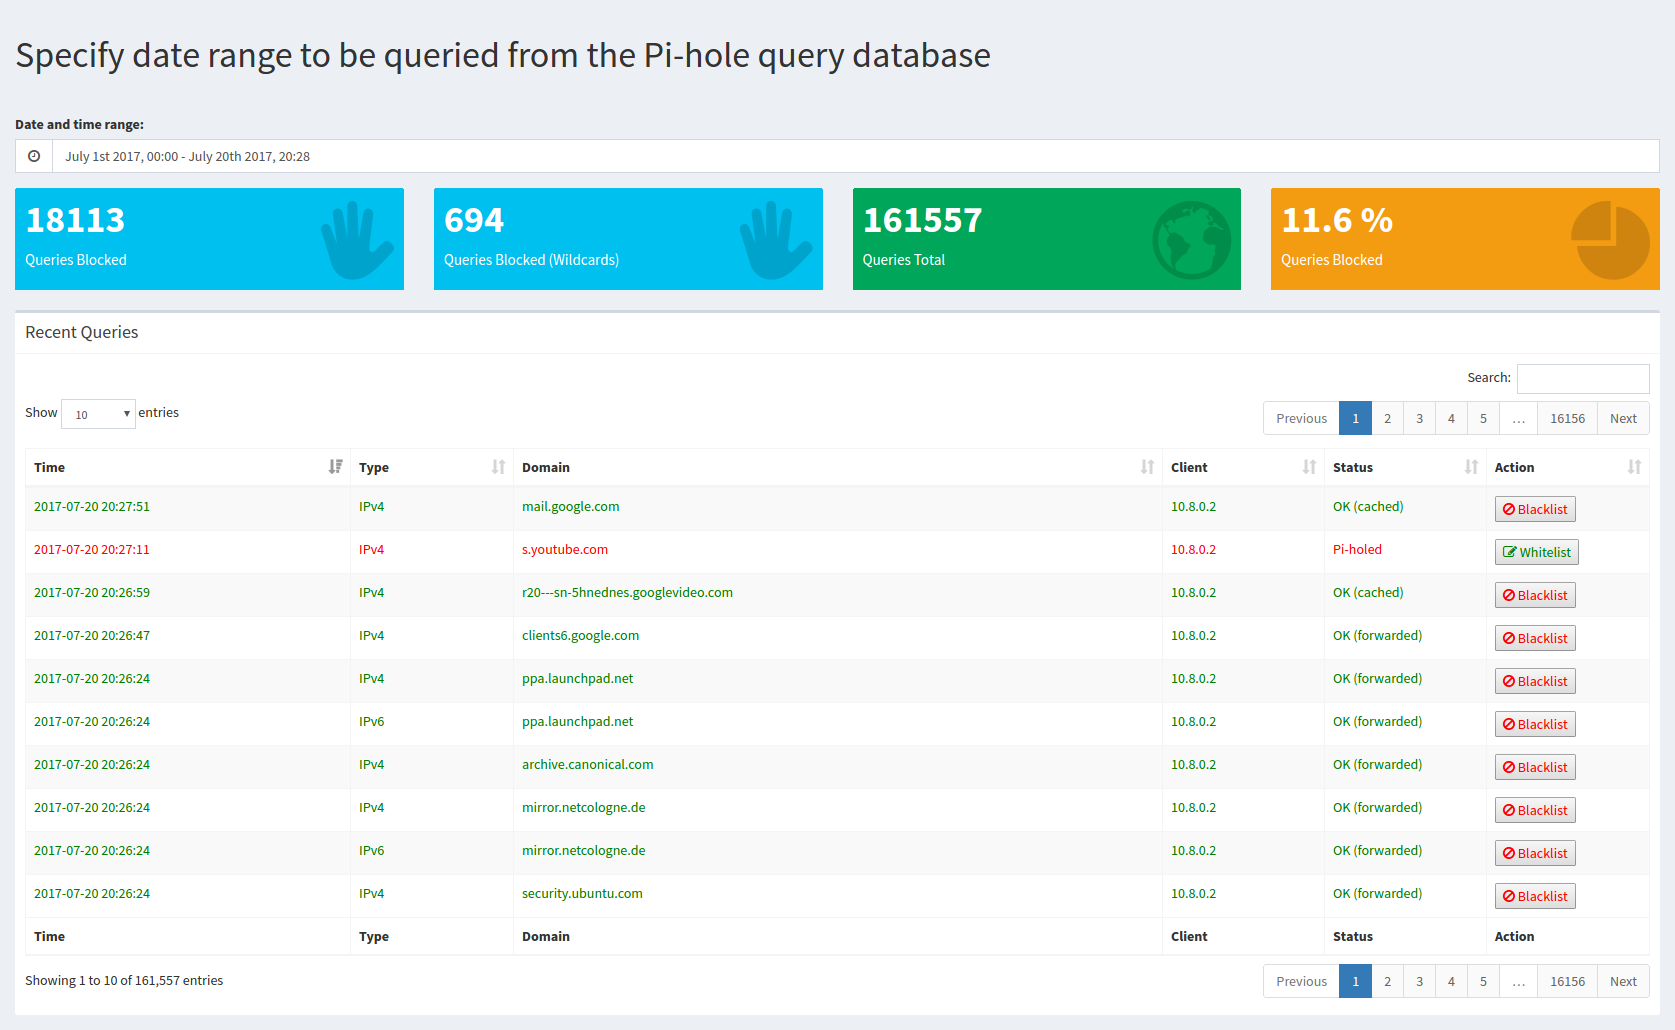
and a Top Clients/Blocked view.
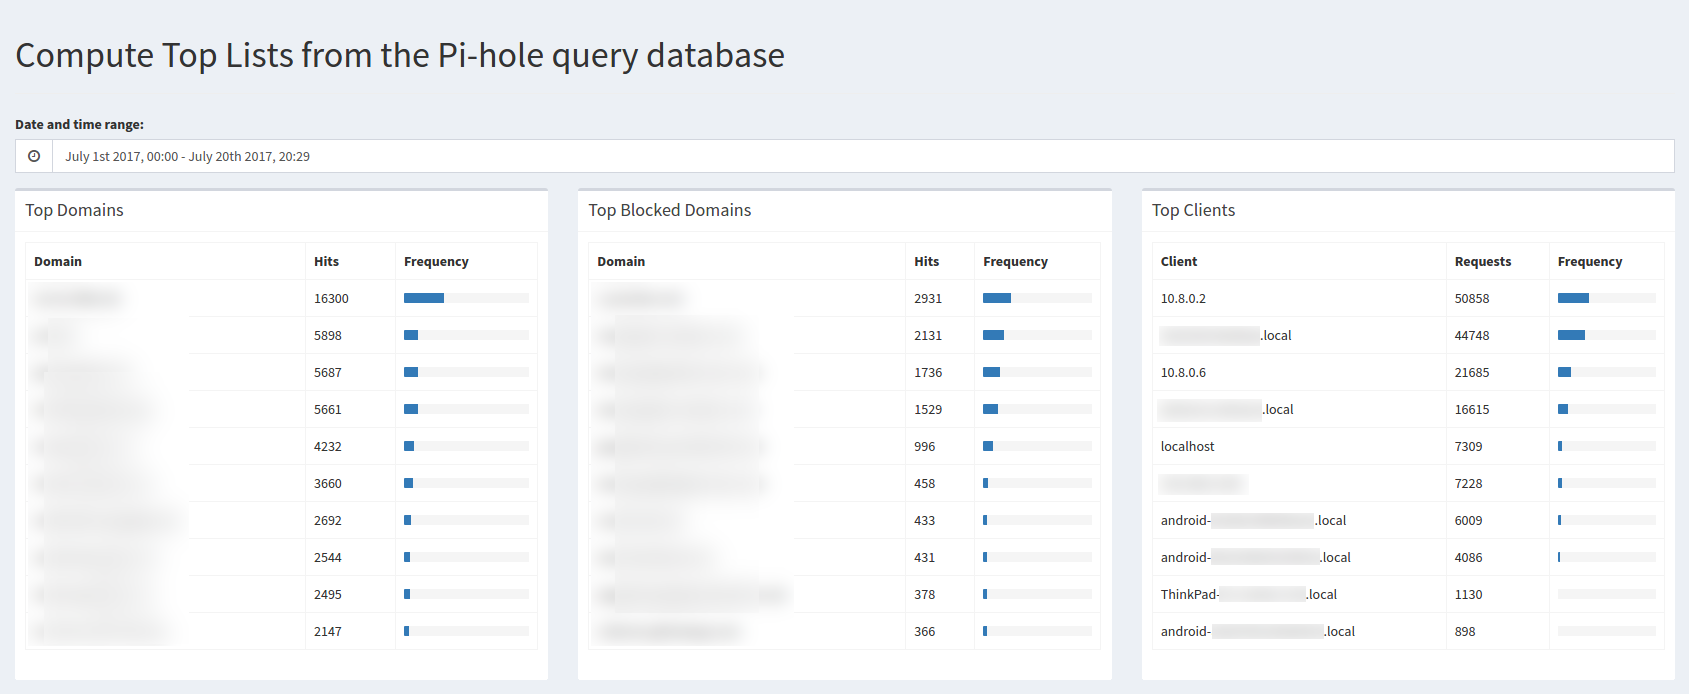
We’re very excited to release the long-term stats feature, as it has been discussed and requested often.
New Settings Layout
Each release of Pi-hole has introduced more and more things to configure on the Settings page. We have broken these out into a tabbed interface for easier navigation.
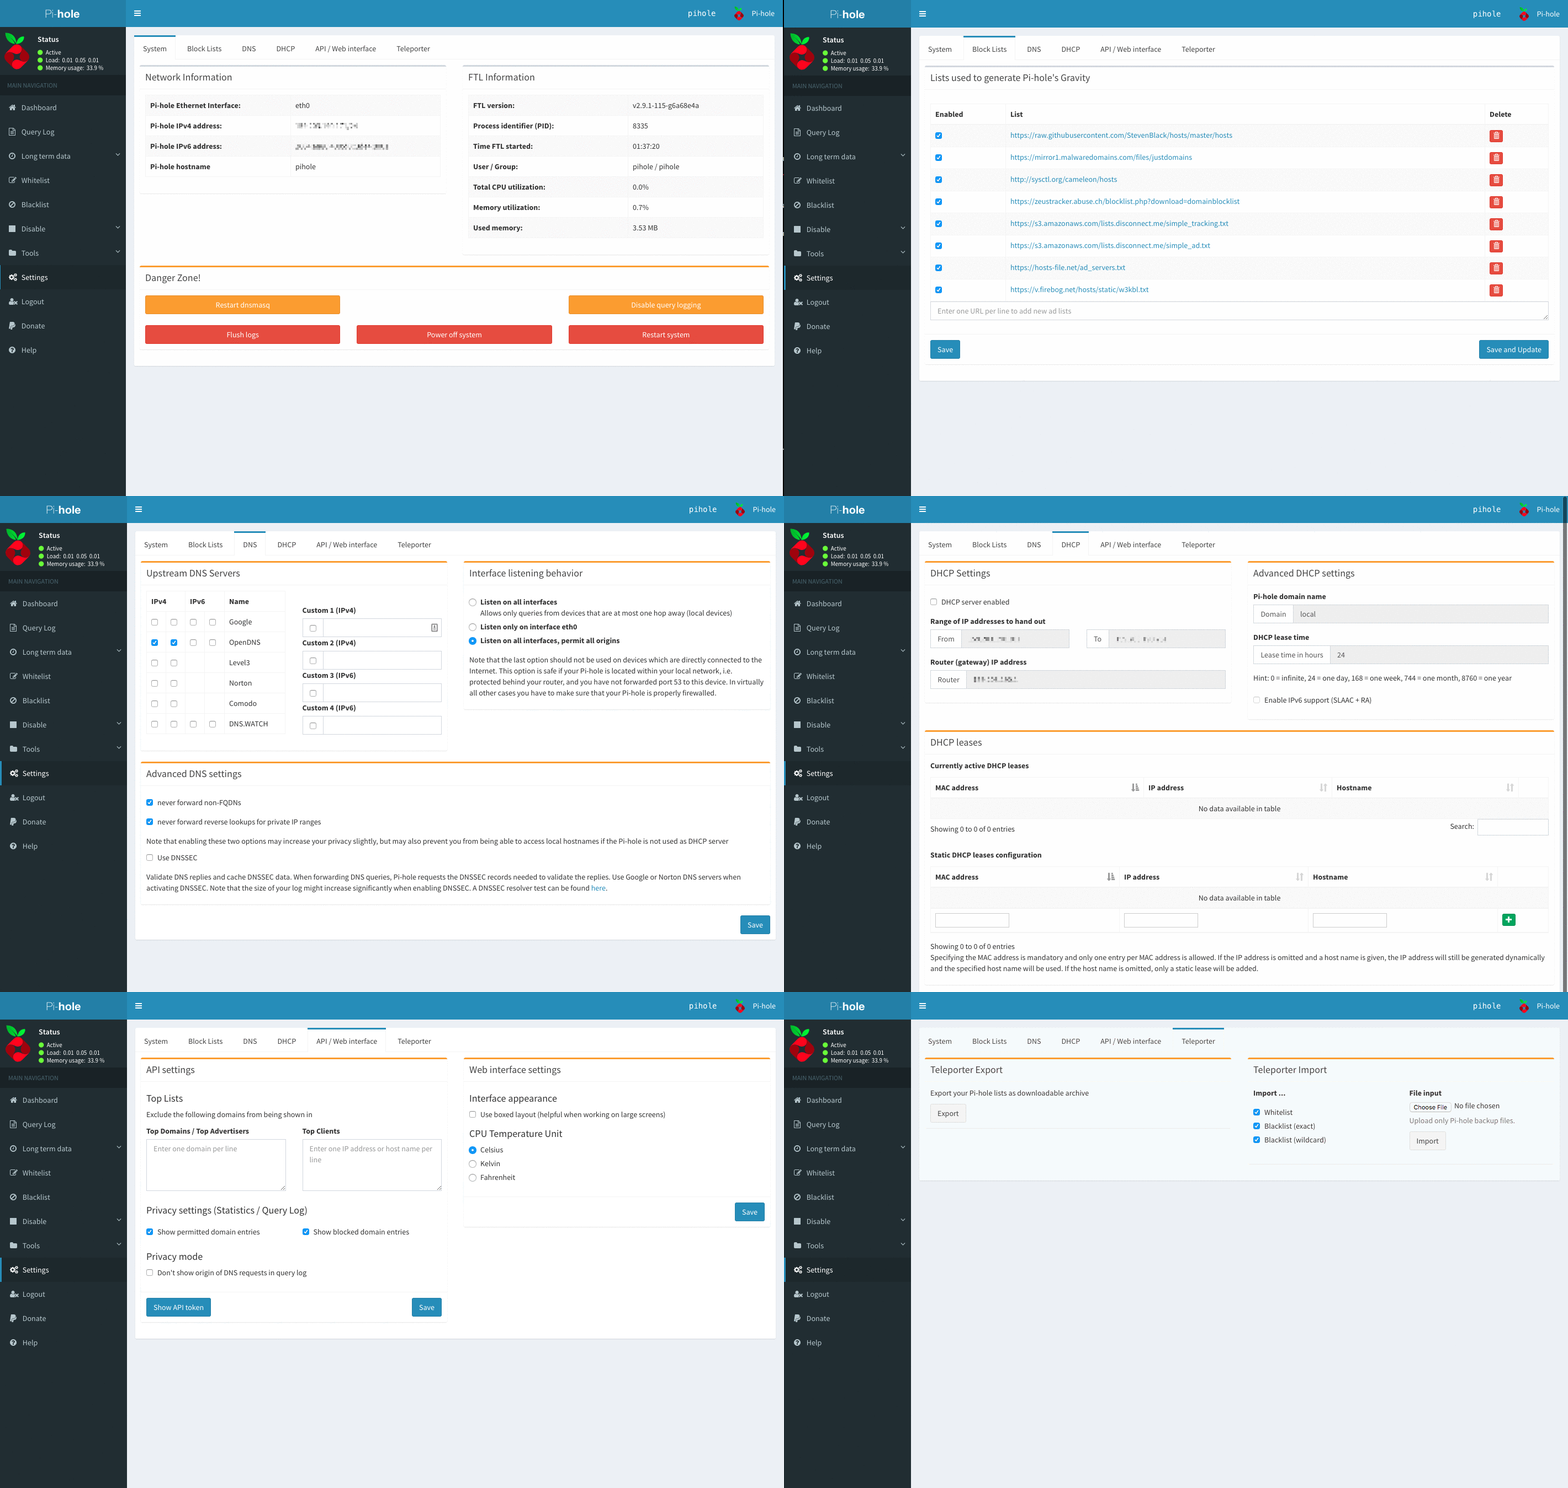
We have also included a nice section under System to restart, shutdown, flush logs, and more.

The Audit Log
This feature, while not as requested as the long-term statistics, is a welcomed enhancement.
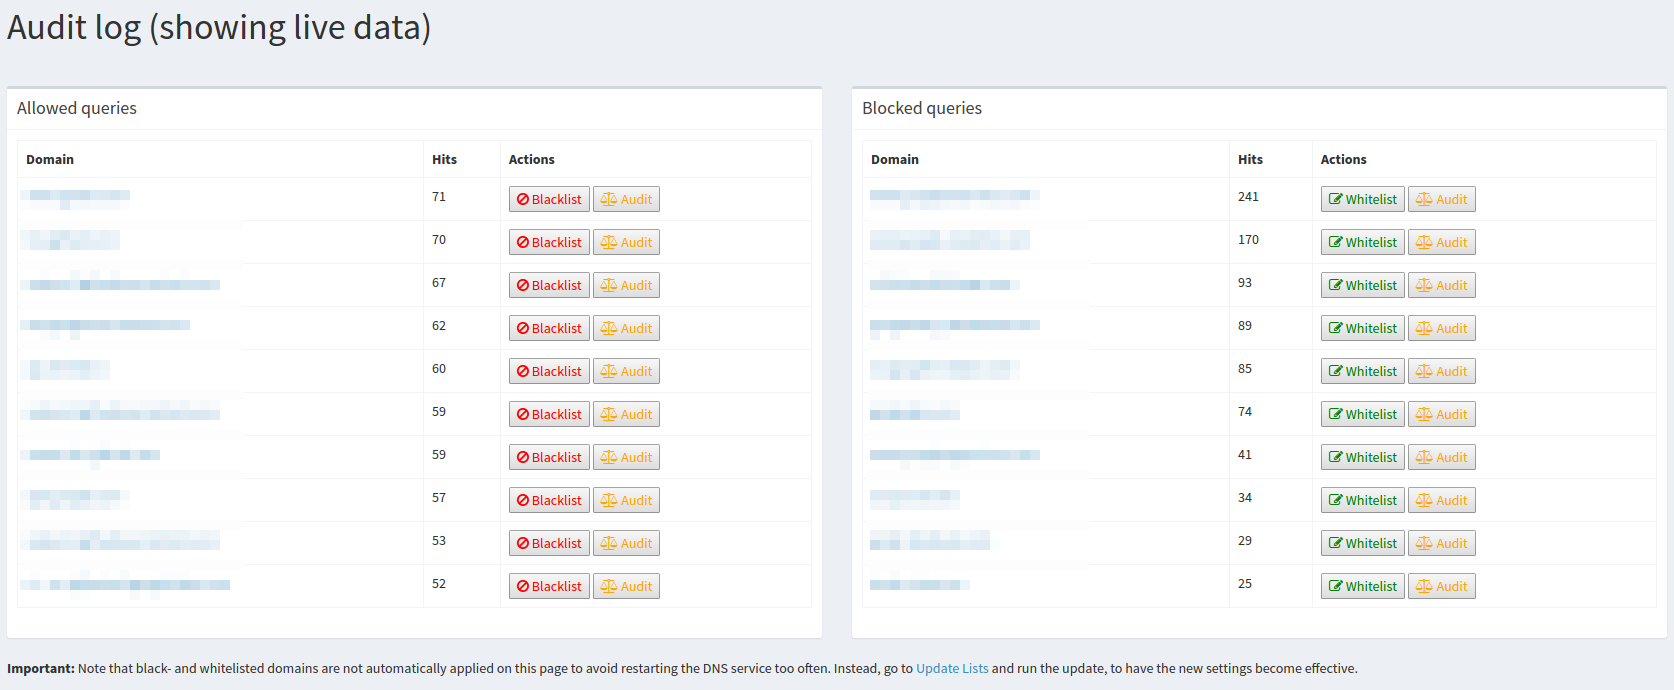
The audit log is a list that contains all domains that have been found in the Pi-hole log. When you click on [Audit], it will be removed from this table and appended to /etc/pihole/auditlog.list, so that it won’t be shown in the future, and so you can view the domains that have already been audited.
It will also give you the option to [White-/Blacklist] this domain with a single click (and hide it afterwards as, since you have decided what will happen with it).
Custom Block Page
If you create /var/www/wordpress/pihole/custom.php, it will override the default block page. So if you have customizations you want to do–that’s how! And we’d love to see what you come up with, so please share your custom block pages with the community.
As part of this block page, we have also introduced the command:
pihole -a email
which will set an contact email address on the block page–useful for those running Pi-hole on a large network so users can email you about certain domains that may be blocked.
Colour All The Things!
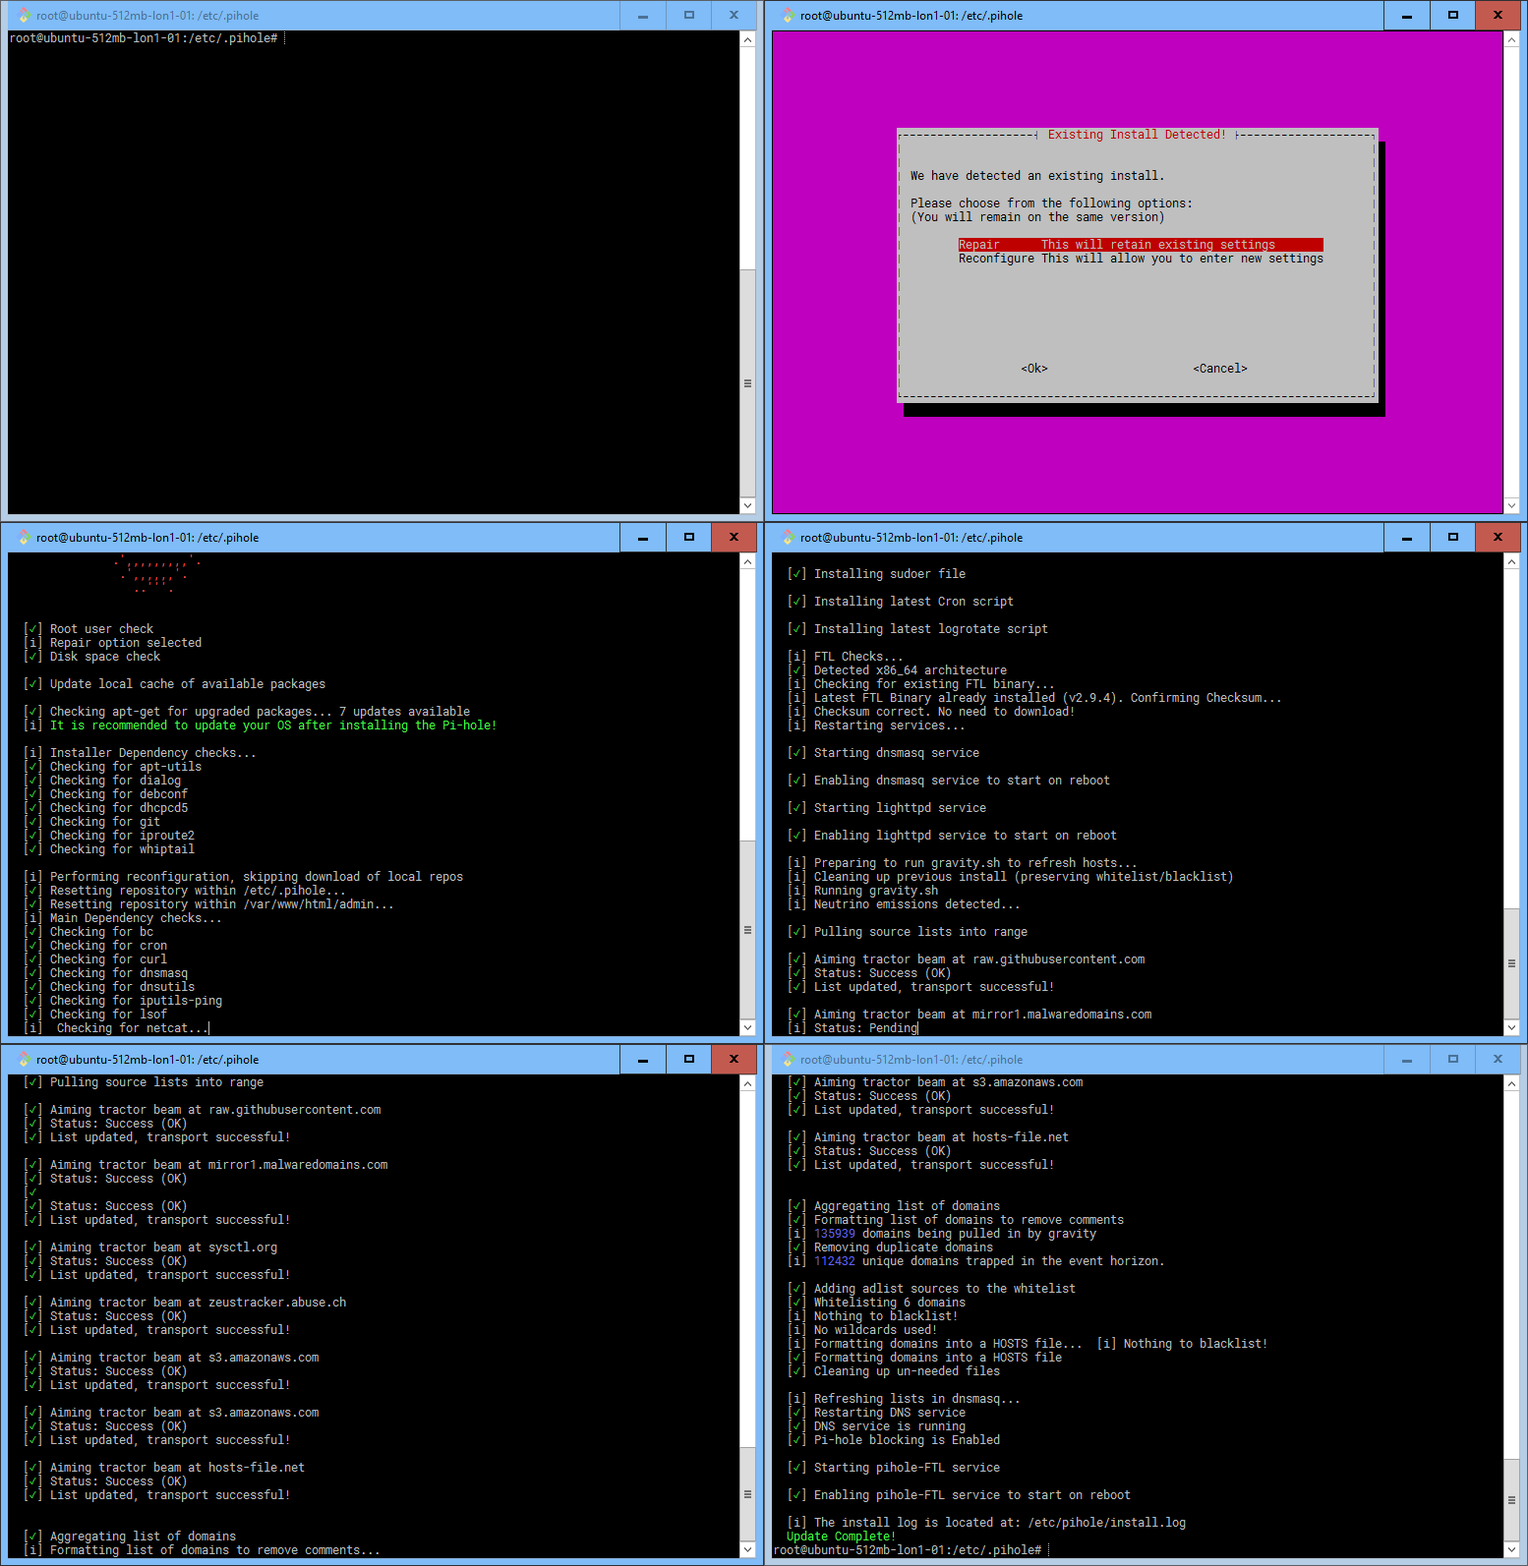
The animation below should explain this new feature well. The code has been updated to show colors in the terminal during installation, when running the debugger, as well as other areas. While mainly aesthetic, there have also been logical changes and performance upgrades, so many things should feel a lot quicker–especially pihole -g.
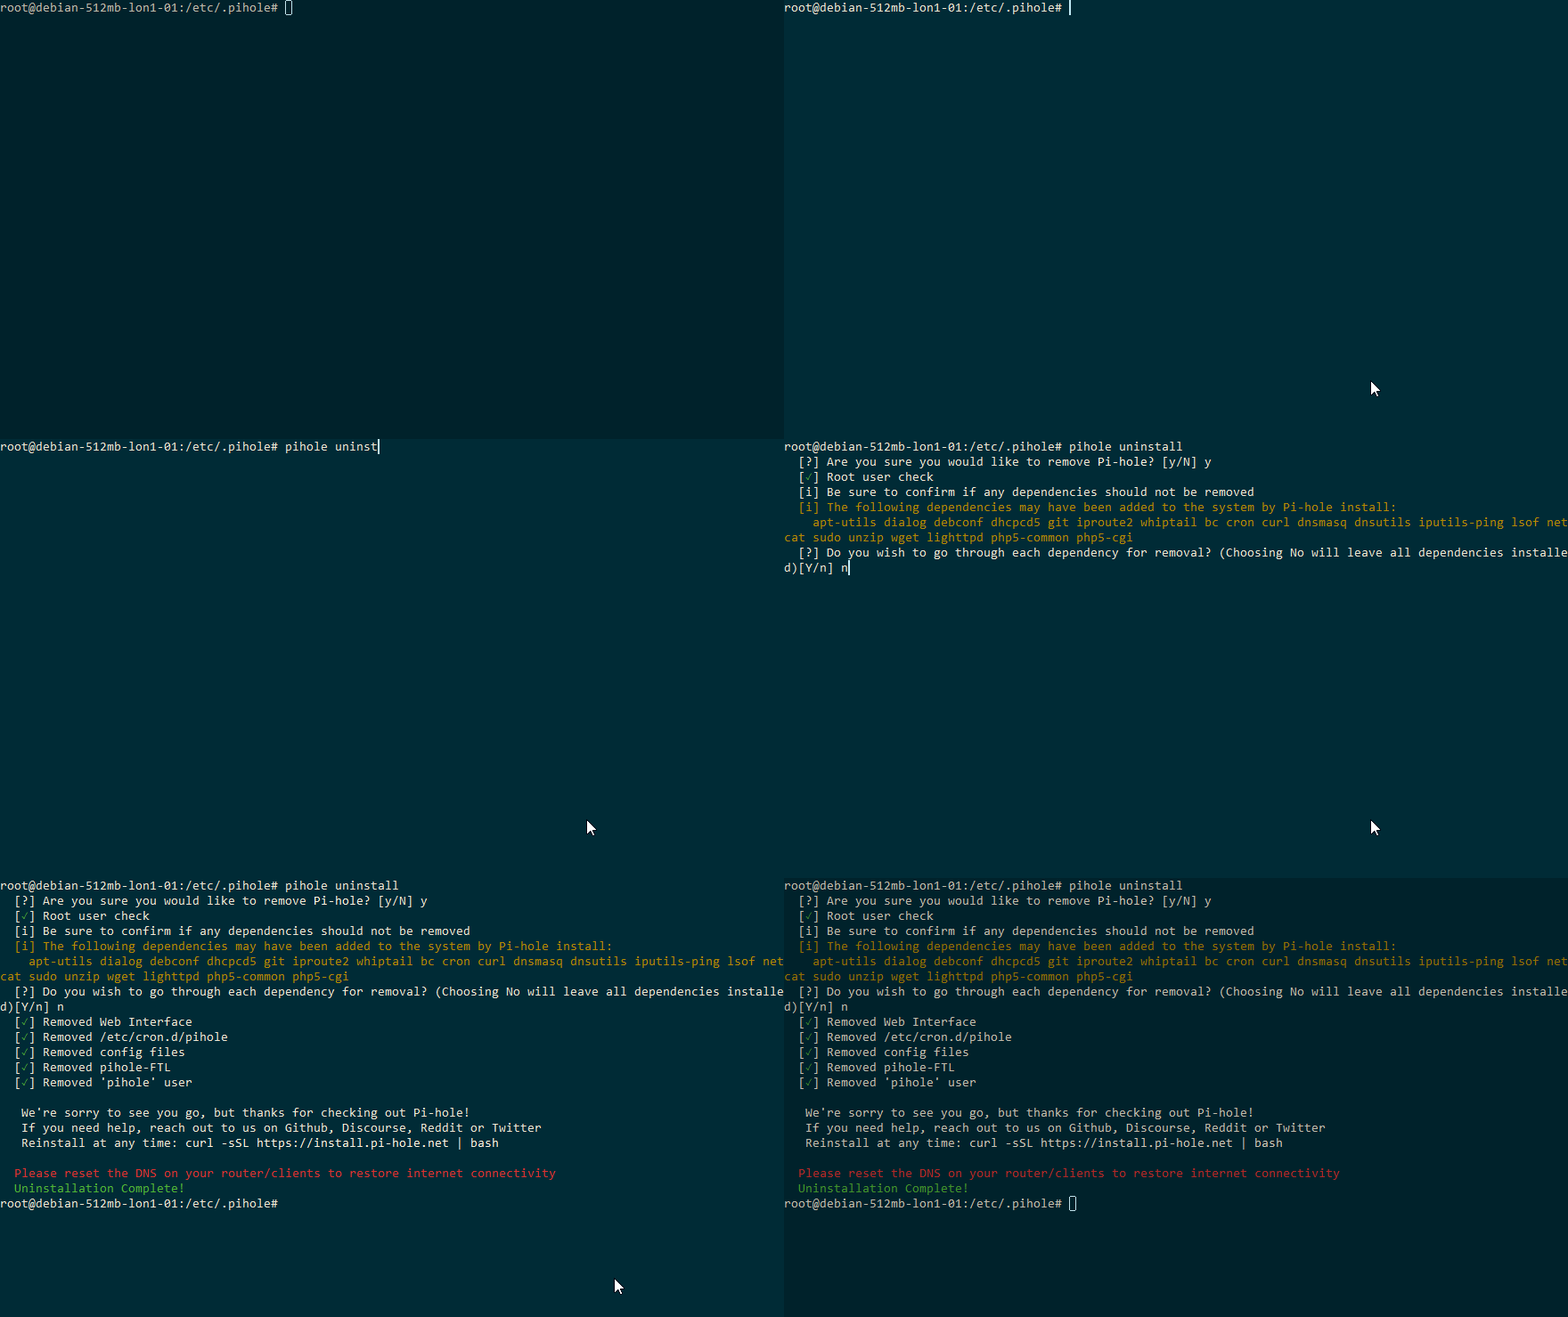
An Improved Uninstall Script
The uninstall script had been neglected for a while, but it now has some much-needed updates.
An Improved Debugger
Our debug process has served us well when you have needed our help with an issue. The new debugger will display things in color (when run from the terminal). Green is nominal, yellow is warning/caution, red is an error.
So if you run pihole -d and see all green, there’s nothing wrong with your installation (although that doesn’t mean there are problems elsewhere on your network or system).
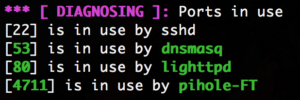
If you do see a yellow or red line, it will also provide a URL to an FAQ.

These FAQs will not only help reduce our support efforts, but it should also help users debug their own installations and find a solution to the error.

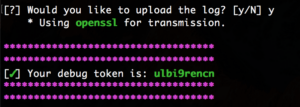
Finally, we have also made it very clear that you need to provide us with the debug token, which will be difficult to miss as it’s highlighted in purple and green.
Comments, Comments, Comments
Pi-hole began as a project for the Raspberry Pi, but has grown well beyond that (we now run on several different Linux distros). But we won’t forget our roots.
To that end, you will find both the debugger script and our install script are now fully commented, so if you want to tinker around, are trying to learn bash, or are just interested in the codebase, those two scripts are the best place to start.
https://youtu.be/5ZvTQXpZDvQ
We also want users to feel like they can contribute to the project, so commenting every line of code is important. For now, the focus is on those two scripts because they are both behemoths, especially considering they are all written in bash. But it also goes to show that you don’t need an extremely high-level language to accomplish some interesting things in a command shell.
The comments in these scripts will help you understand how we put Pi-hole together and hopefully let people feel like they can contribute to our project without fear of rejection or embarrassment.
We also think Pi-hole is a great learning tool; one: because it’s relatively easy for a novice to install Pi-hole and start blocking ads without much knowledge about Linux; and two: because shell scripts are still very commonplace in Linux and our scripts showcase that you can accomplish the same things as some higher level languages.
Our scripts have everything from variables to arrays and loops to parameter expansions, so there is a variety of things you can learn and see how they can be used in a real life situation.
So whether you’re new to Pi-hole or have been around for a while, there’s something for you to enjoy.
Chronometer2
Chronometer2 will now display nicely on smaller screens.; we meant to get it out with the last release, but here it is now. Enjoy.
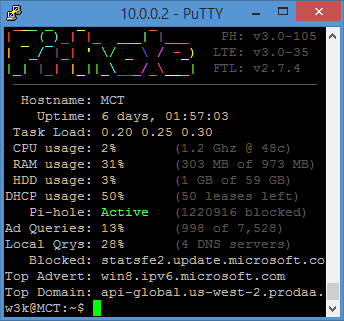
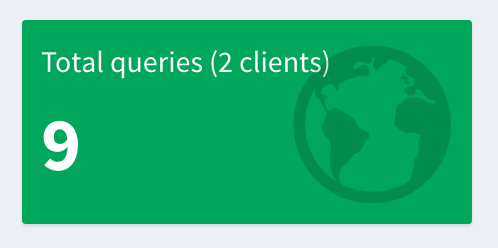
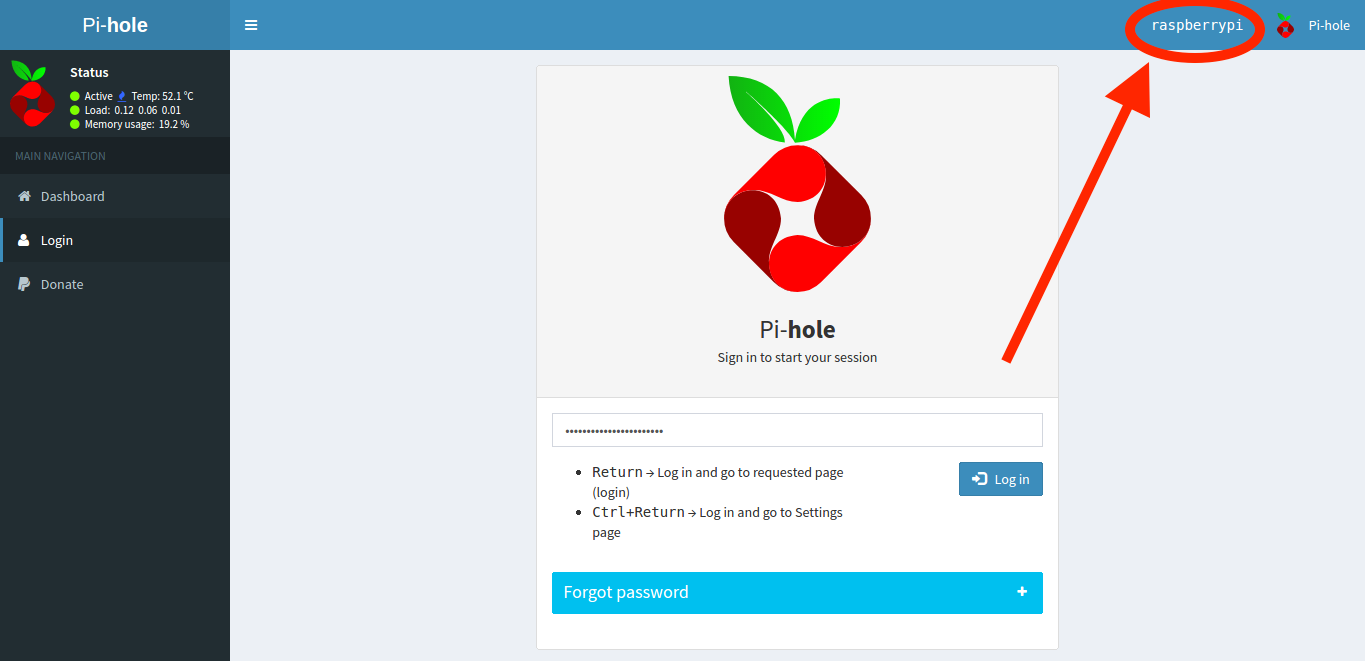
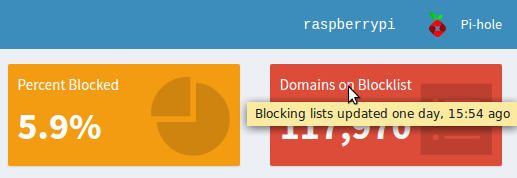
Number Of Clients, Hostname In Header, And Tool Tips
This screenshots below should explain these tweaks.

pihole -q Is More Friendly To Read
pihole -q doubleclick.com
Result from list.5.v.firebog.net.domains
  doubleclick.com
  www.doubleclick.com
Result from list.14.v.firebog.net.domains
  ad-apac.doubleclick.com
  ad-emea.doubleclick.com
  ad.doubleclick.com
  ads.doubleclick.com
  advertisers.doubleclick.com
  advertisersapitest.doubleclick.com
  amazon.doubleclick.com
  betareportcentral.doubleclick.com
  click.comms.doubleclick.com
  doubleclick.com
  Over 10 results found, skipping rest of file
Result from list.52.v.firebog.net.domains
  doubleclick.com
Using Pi-hole With A VPN
Many users have been deploying Pi-hole on a Digital Ocean droplet, which works pretty nice, but we recommend pairing it with a VPN, so you don’t end up making an open resolver. We have a full write-up on how to do this. You also get the added benefit of encrypting your network traffic–always a plus!
What’s Fixed?
- An annoying and confusing bug that showed Pi-hole’s hostname as a domain name from a blocklist
- A wildcarding issue when running gravity (
pihole -g) - Underscores can be accepted in domain names
- Removed
netstatdependency (as it is no longer included with Debian Stretch) - and more…
See all of the fixes, tweaks, and new features at changes.pi-hole.net.
Thank You
Once again, thank you for your continued support.
